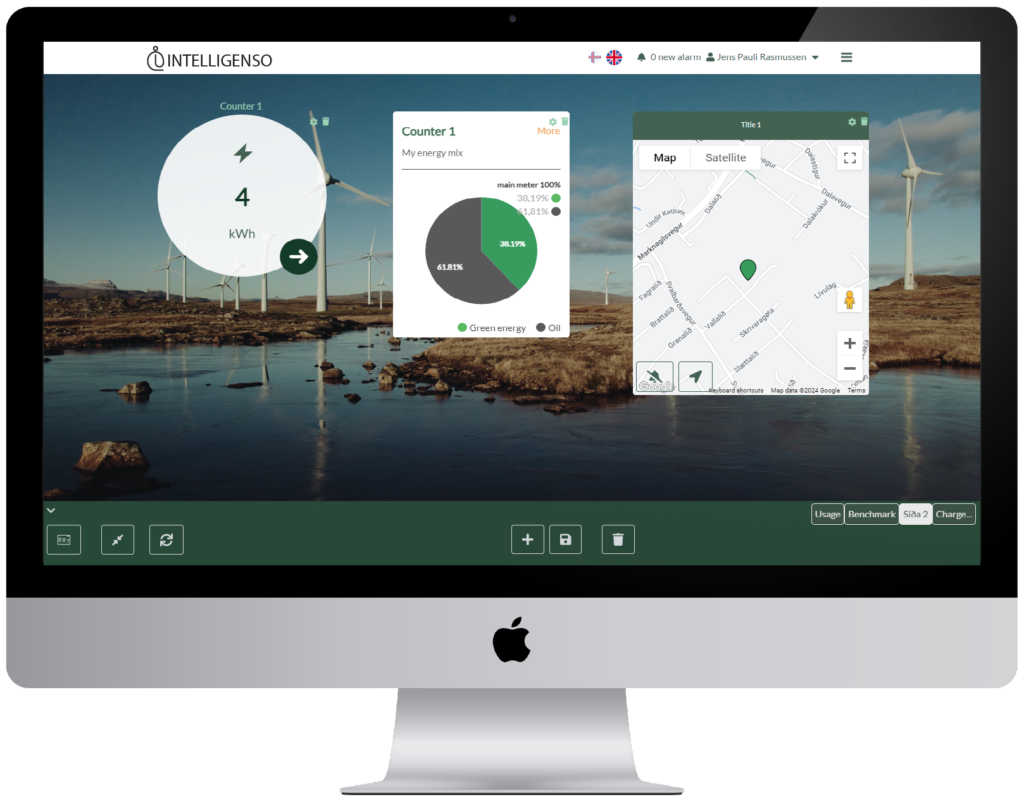
“A customizable dashboard for data presentations provides the flexibility, interactivity, and visualization capabilities necessary to effectively communicate insights, promote data-driven decision-making, and drive organizational performance for your users whether they are a single meter user or a large user with multiple meters.”
Visual Data Representation: A customizable dashboard allows data to be presented visually using charts, graphs, tables, and other visualizations. Visual representations are often easier to understand and interpret than raw data or lengthy reports. By presenting data visually, a dashboard enhances data comprehension, enabling stakeholders to grasp complex information quickly and make informed decisions.
Personalization and Contextualization: Customizable dashboards empower users to personalize their data presentation based on their specific needs and preferences. Users can choose the metrics, KPIs (Key Performance Indicators), and visualizations they want to see, tailoring the dashboard to their unique requirements. This customization helps your users focus on the most relevant information and gain actionable insights within their specific context.
Real-time Data Monitoring: Dashboards can display real-time or near real-time data, providing an up-to-the-minute view of key metrics and performance indicators. This real-time monitoring allows stakeholders to track progress, identify trends, and respond quickly to changing conditions. By providing timely insights, a customizable dashboard supports proactive decision-making and facilitates agile business operations. Just note that while most data from smart meters are received once per day or similar, whereas real-time data from external sensors can be added.
Data Drill-Down and Exploration: A well-designed dashboard allows users to drill down into the data, exploring different levels of detail or additional dimensions. Users can interact with the dashboard, filter data, and access underlying datasets for deeper analysis. This interactive capability promotes data exploration, enabling users to uncover hidden patterns, identify root causes, and discover new insights.
Cross-functional Collaboration: Dashboards can be shared across teams and departments, facilitating collaboration, and fostering a data-driven culture. By providing a common visual representation of data, a customizable dashboard encourages cross-functional discussions and knowledge sharing. Stakeholders from different areas of the organization can align their efforts, collaborate on problem-solving, and make decisions based on a shared understanding of the data.
Performance Tracking and Goal Setting: Dashboards can track performance against predefined goals and targets. By visualizing performance metrics and progress indicators, a customizable dashboard helps organizations monitor their performance in real time and make necessary adjustments to achieve their objectives. This goal-oriented approach promotes accountability, motivates you’re users, and drives continuous improvement.